Real-Time Insights That Actually Improve Your Events
Event Tech Stack tracks registration, attendance, engagement, and streaming in real time so you can see what’s working, what’s not, and adjust while your event is still in motion.
Event data shouldn't be hard to access
Most teams spend hours pulling reports from different systems, only to realize the insights come too late to do anything with them.

Data lives in multiple places
Registration data is in one tool, streaming analytics in another, engagement somewhere else. By the time everything is exported and combined, you’ve already lost time you could’ve spent improving the event.
Reports come too late
You need to know what’s happening during your event, not after it’s over. When registration slows or engagement drops, waiting on reports means you miss the chance to adjust.
Difficult to prove ROI
You know your events are driving value, but pulling that story together across disconnected systems is time-consuming and inconsistent.
Missed optimization opportunities
When data is scattered, it’s harder to see what worked and what didn’t. That means the same issues carry over from one event to the next.
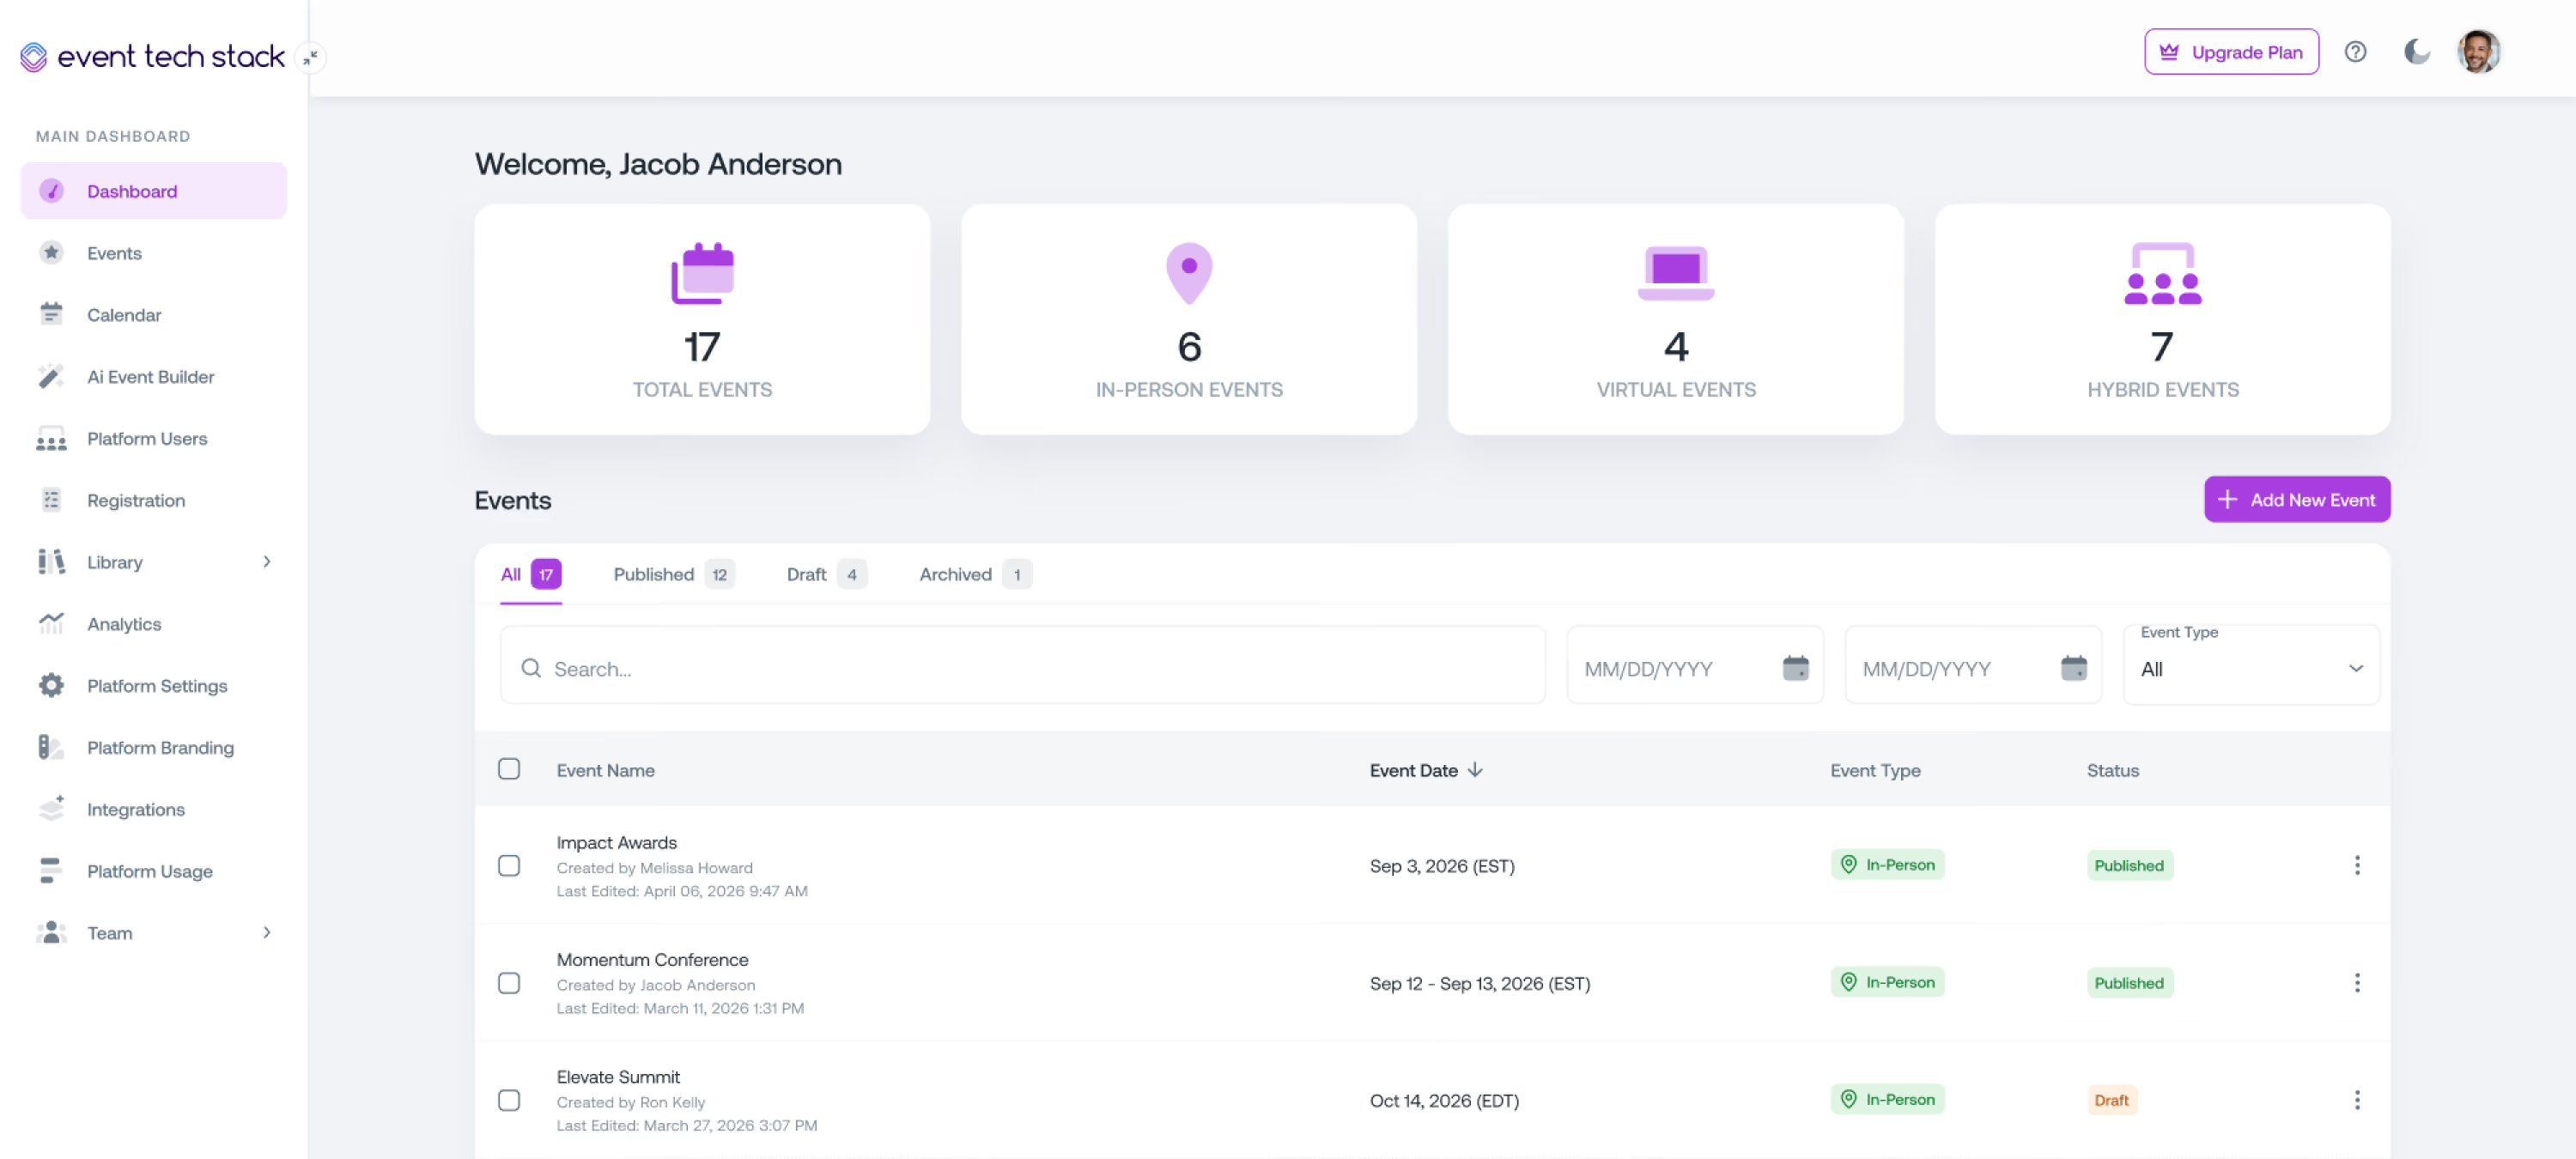
One dashboard for everything that matters
Registration, attendance, engagement, and streaming all live in one place, so you can see what’s happening and make decisions without switching between tools.
Unified Analytics
See every metric that matters in one unified view
Track registrations, session attendance, livestream viewership, engagement activity, and email performance from a single dashboard.
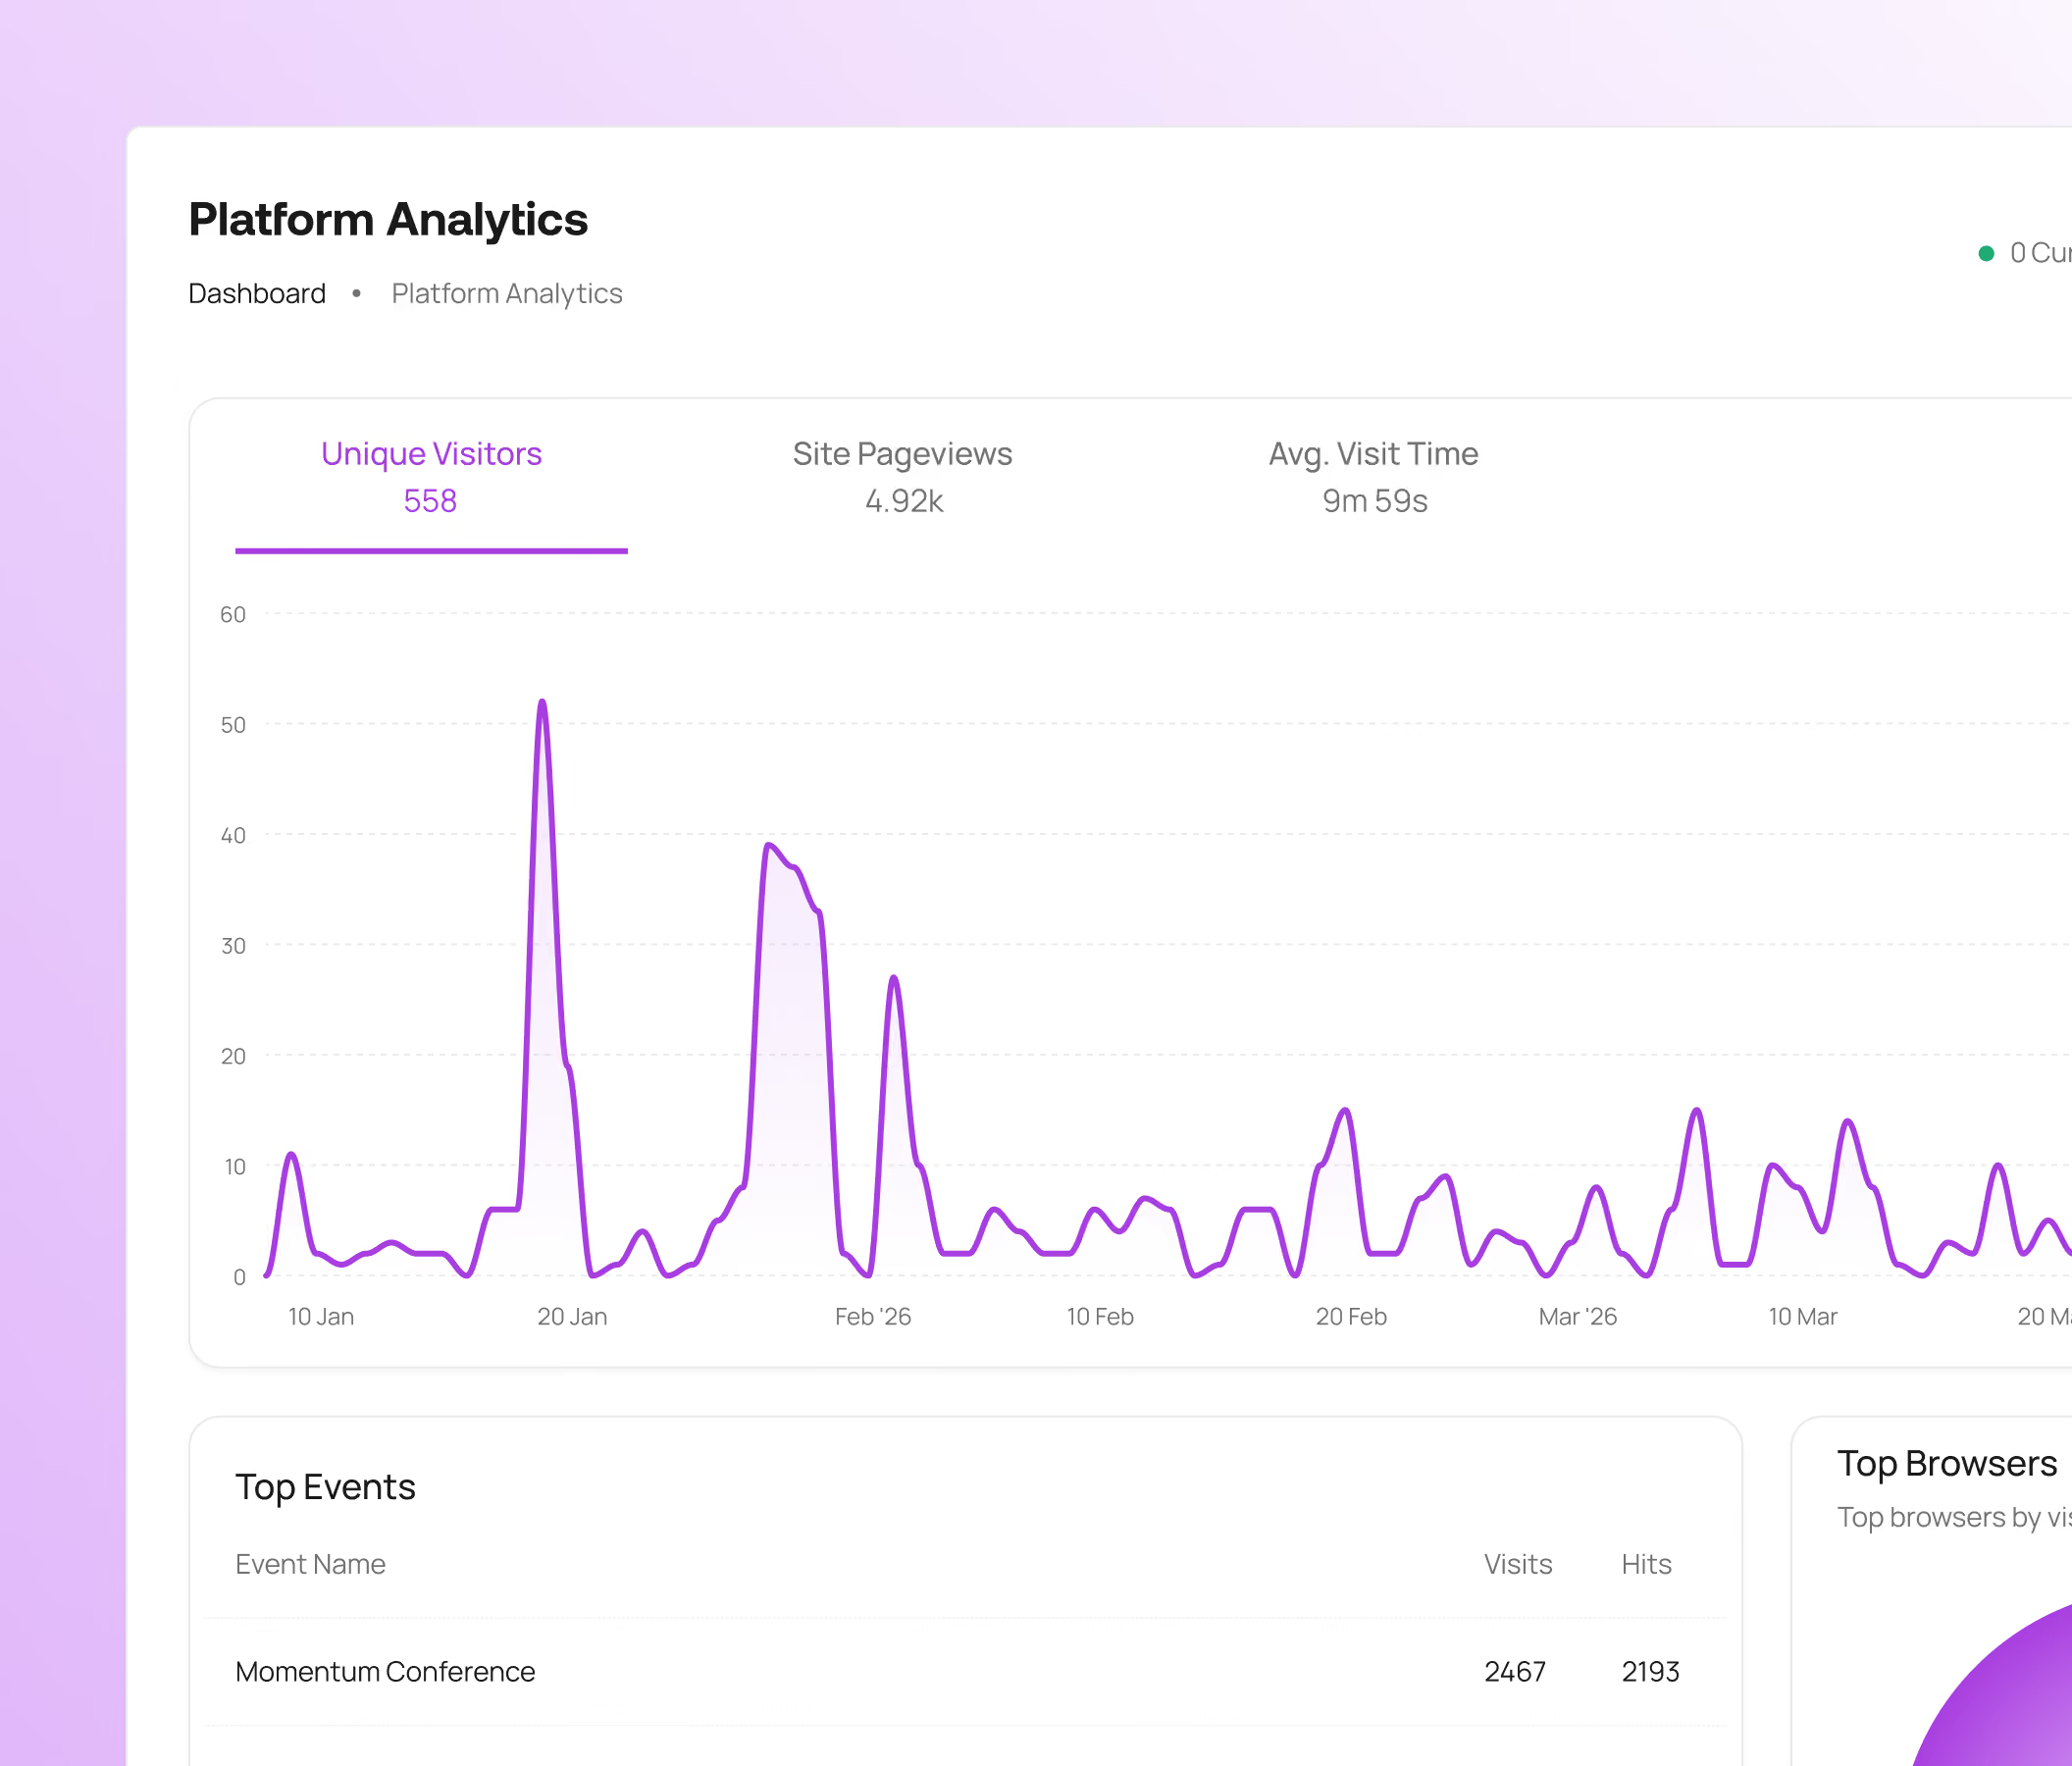
Real-Time Dashboards
Monitor your event as it happens, not after it's over
Watch registrations come in, track session capacity in real time, see livestream viewer counts, and monitor engagement as it happens.
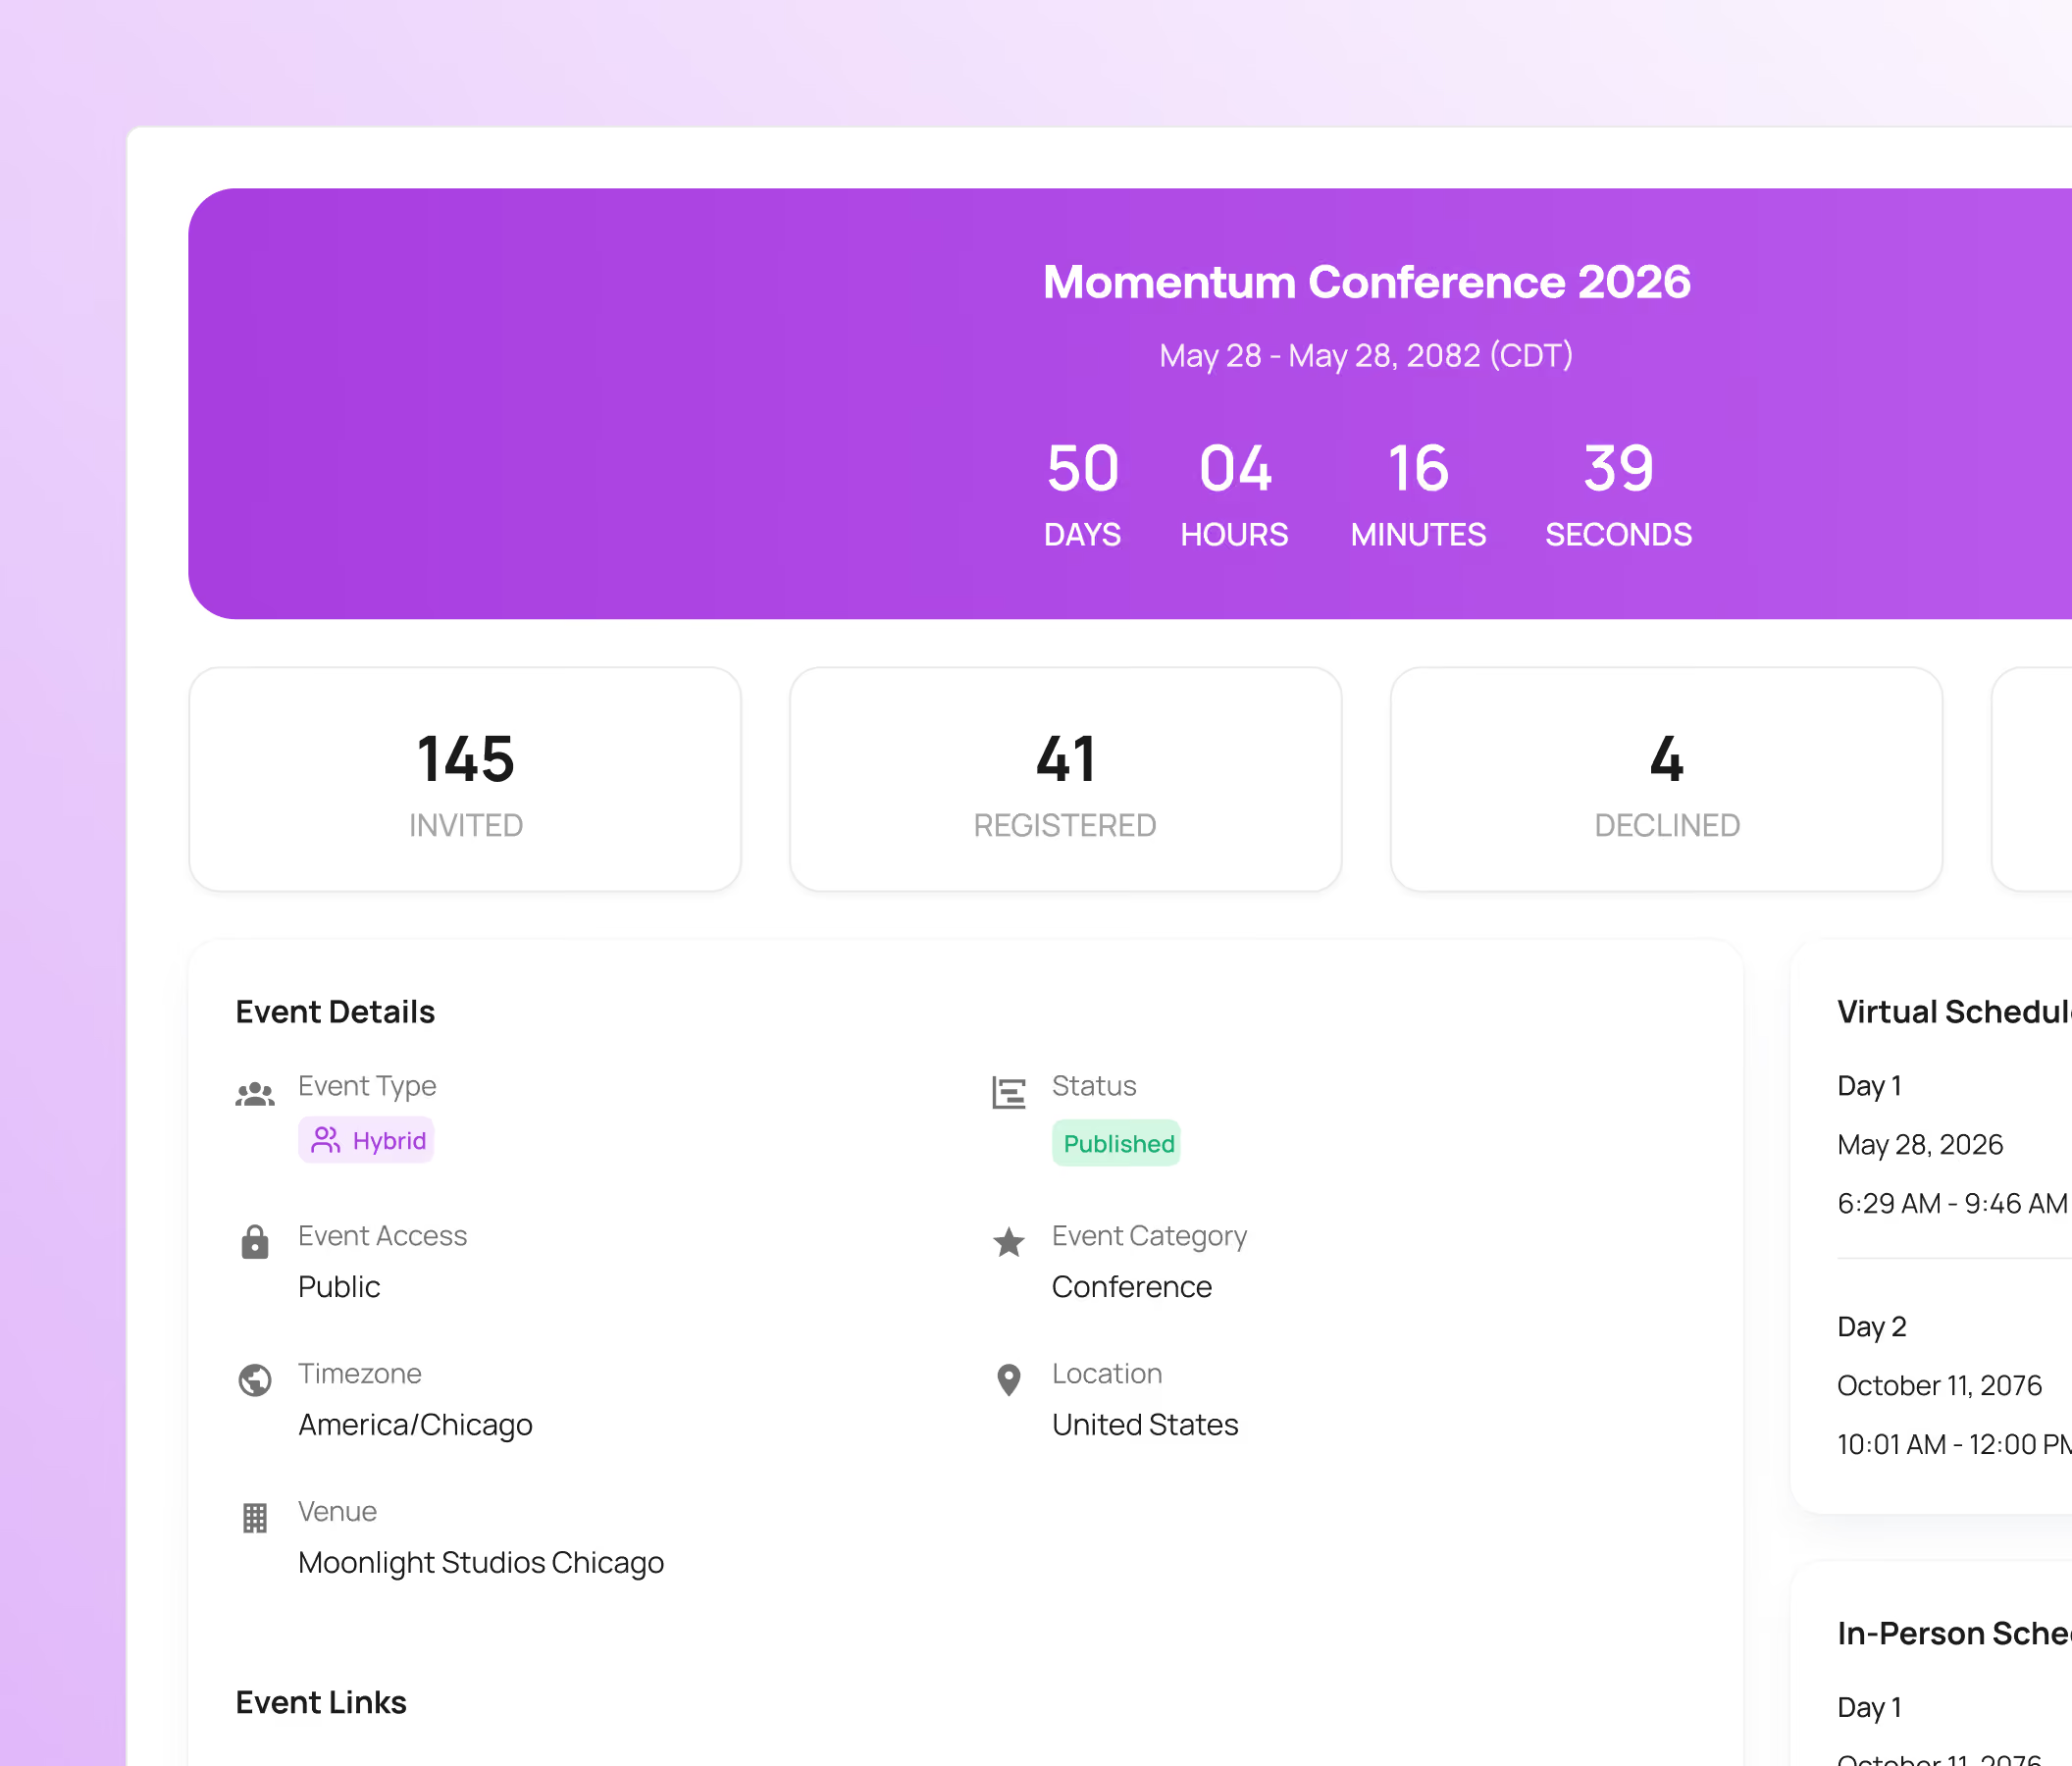
ROI Metrics
Prove event value with the right data
Build reports that clearly show performance without piecing data together from multiple systems.
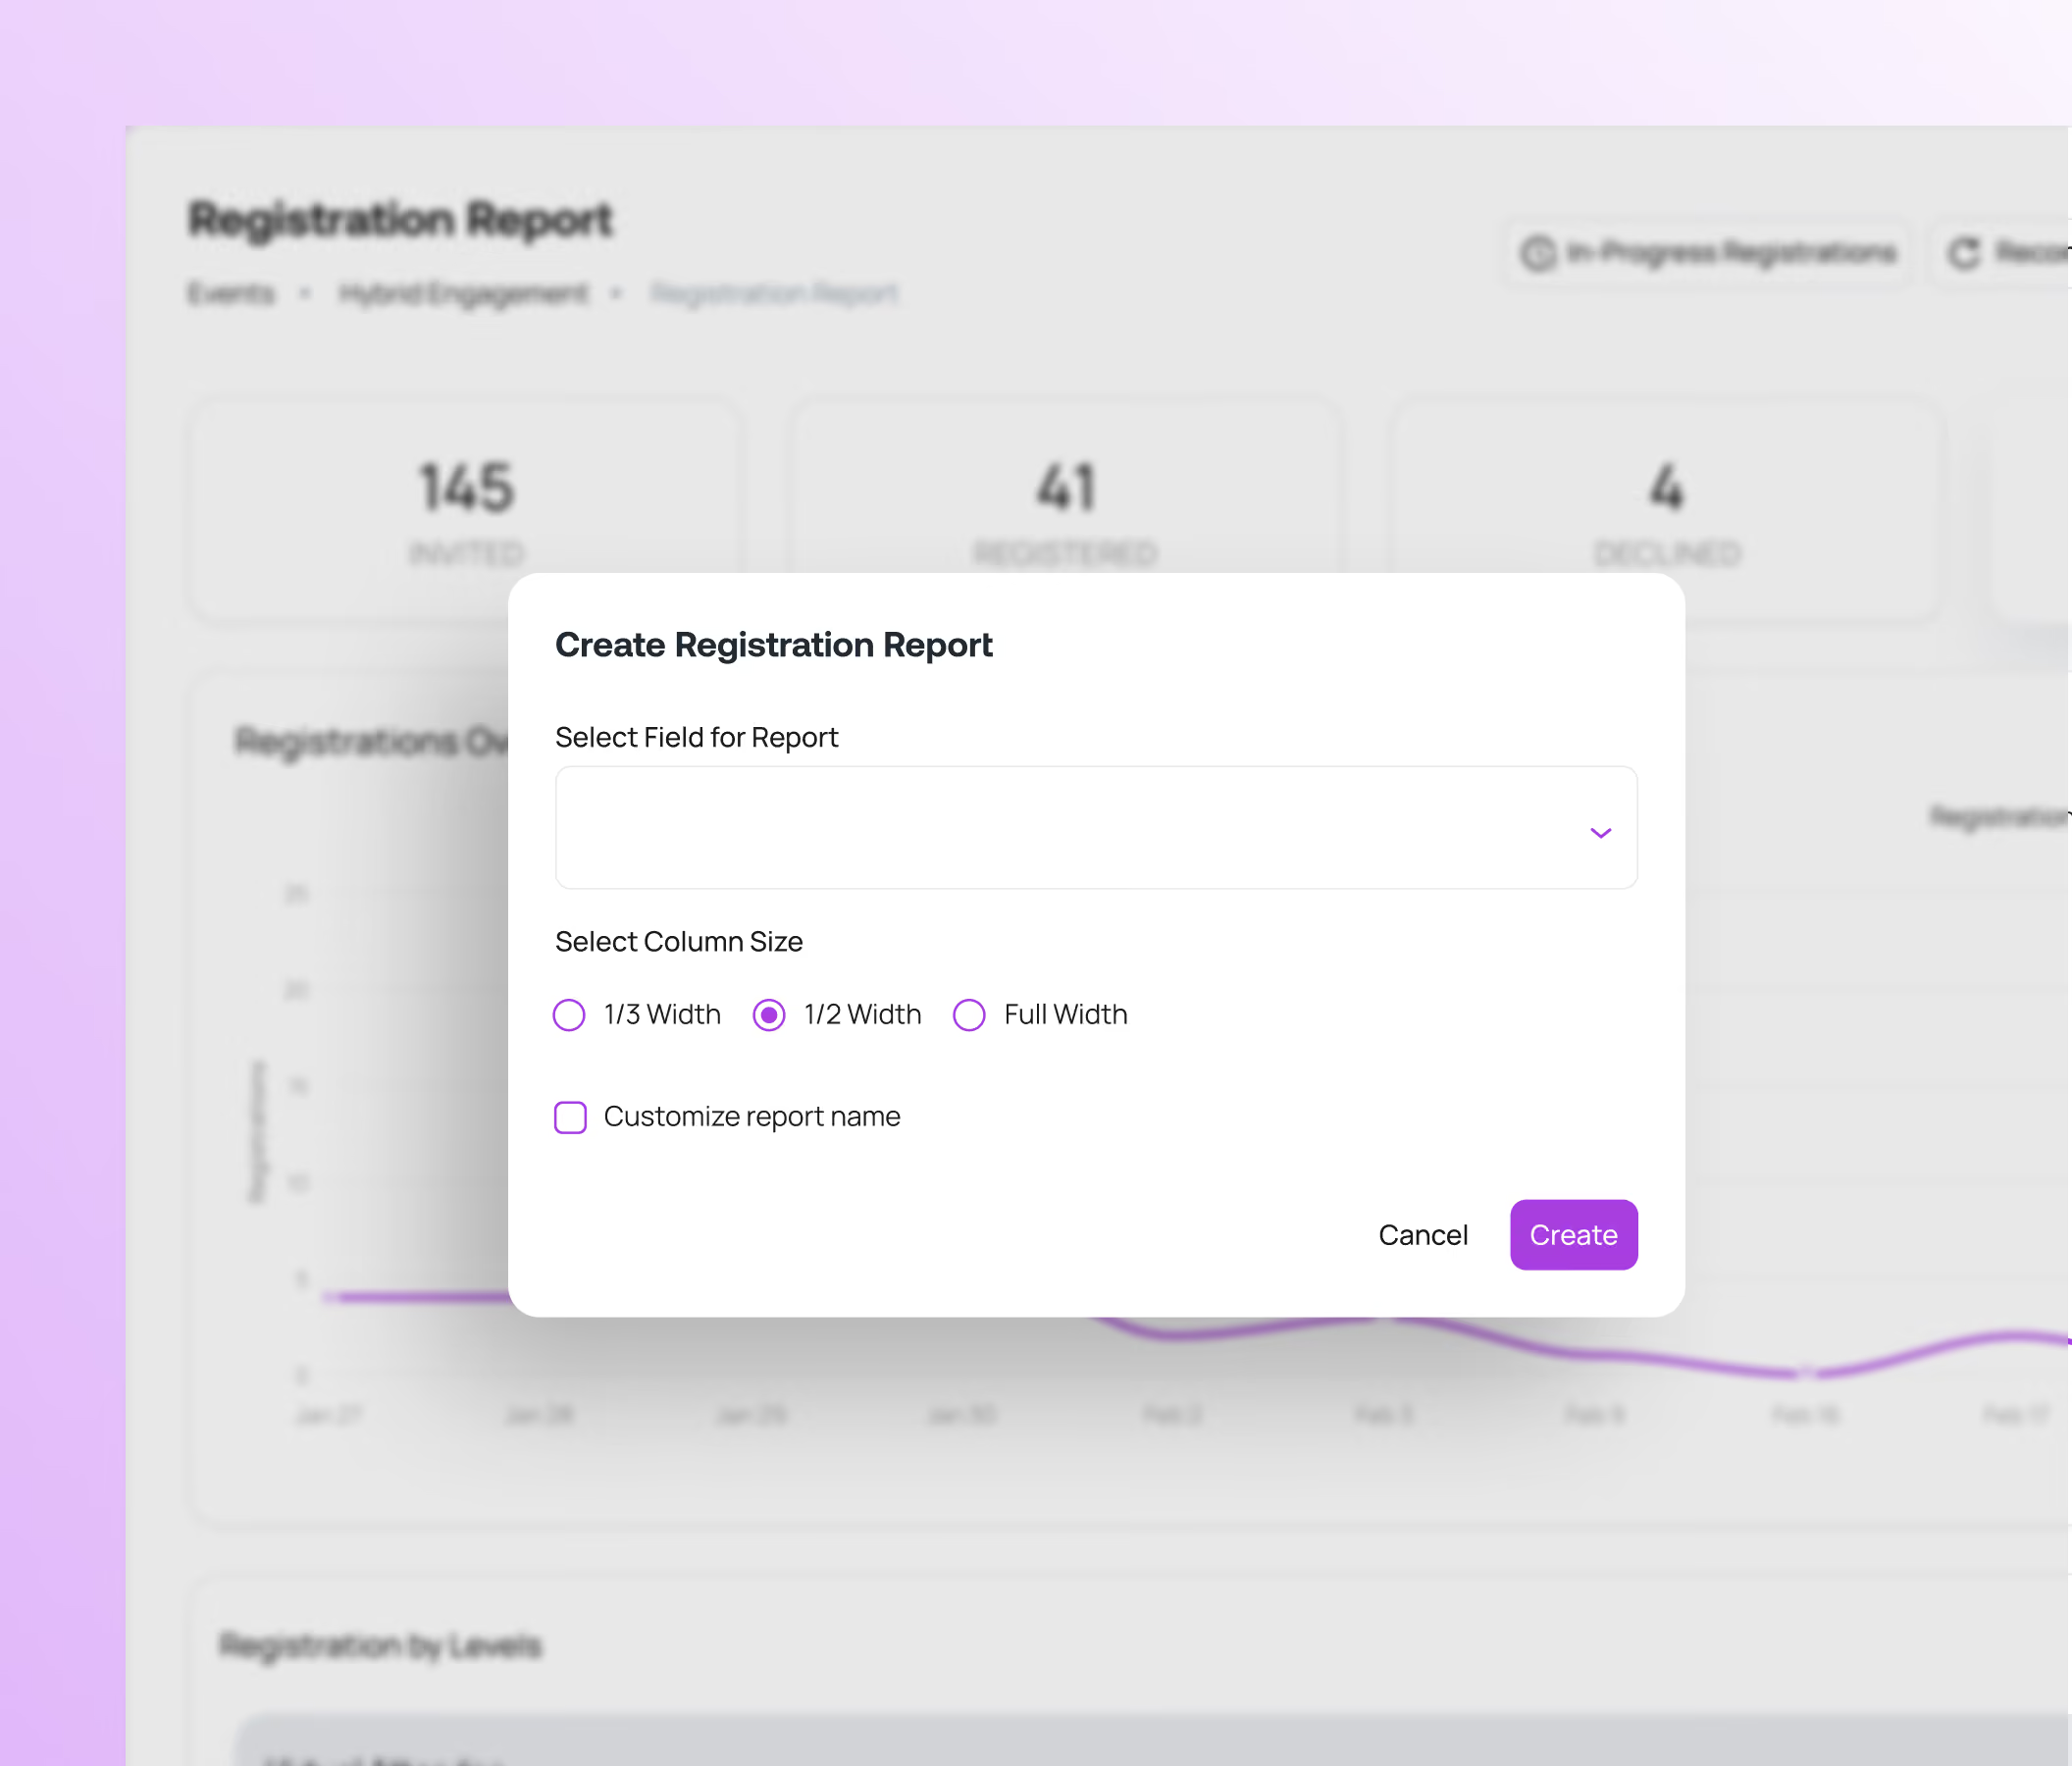
Exportable Reports
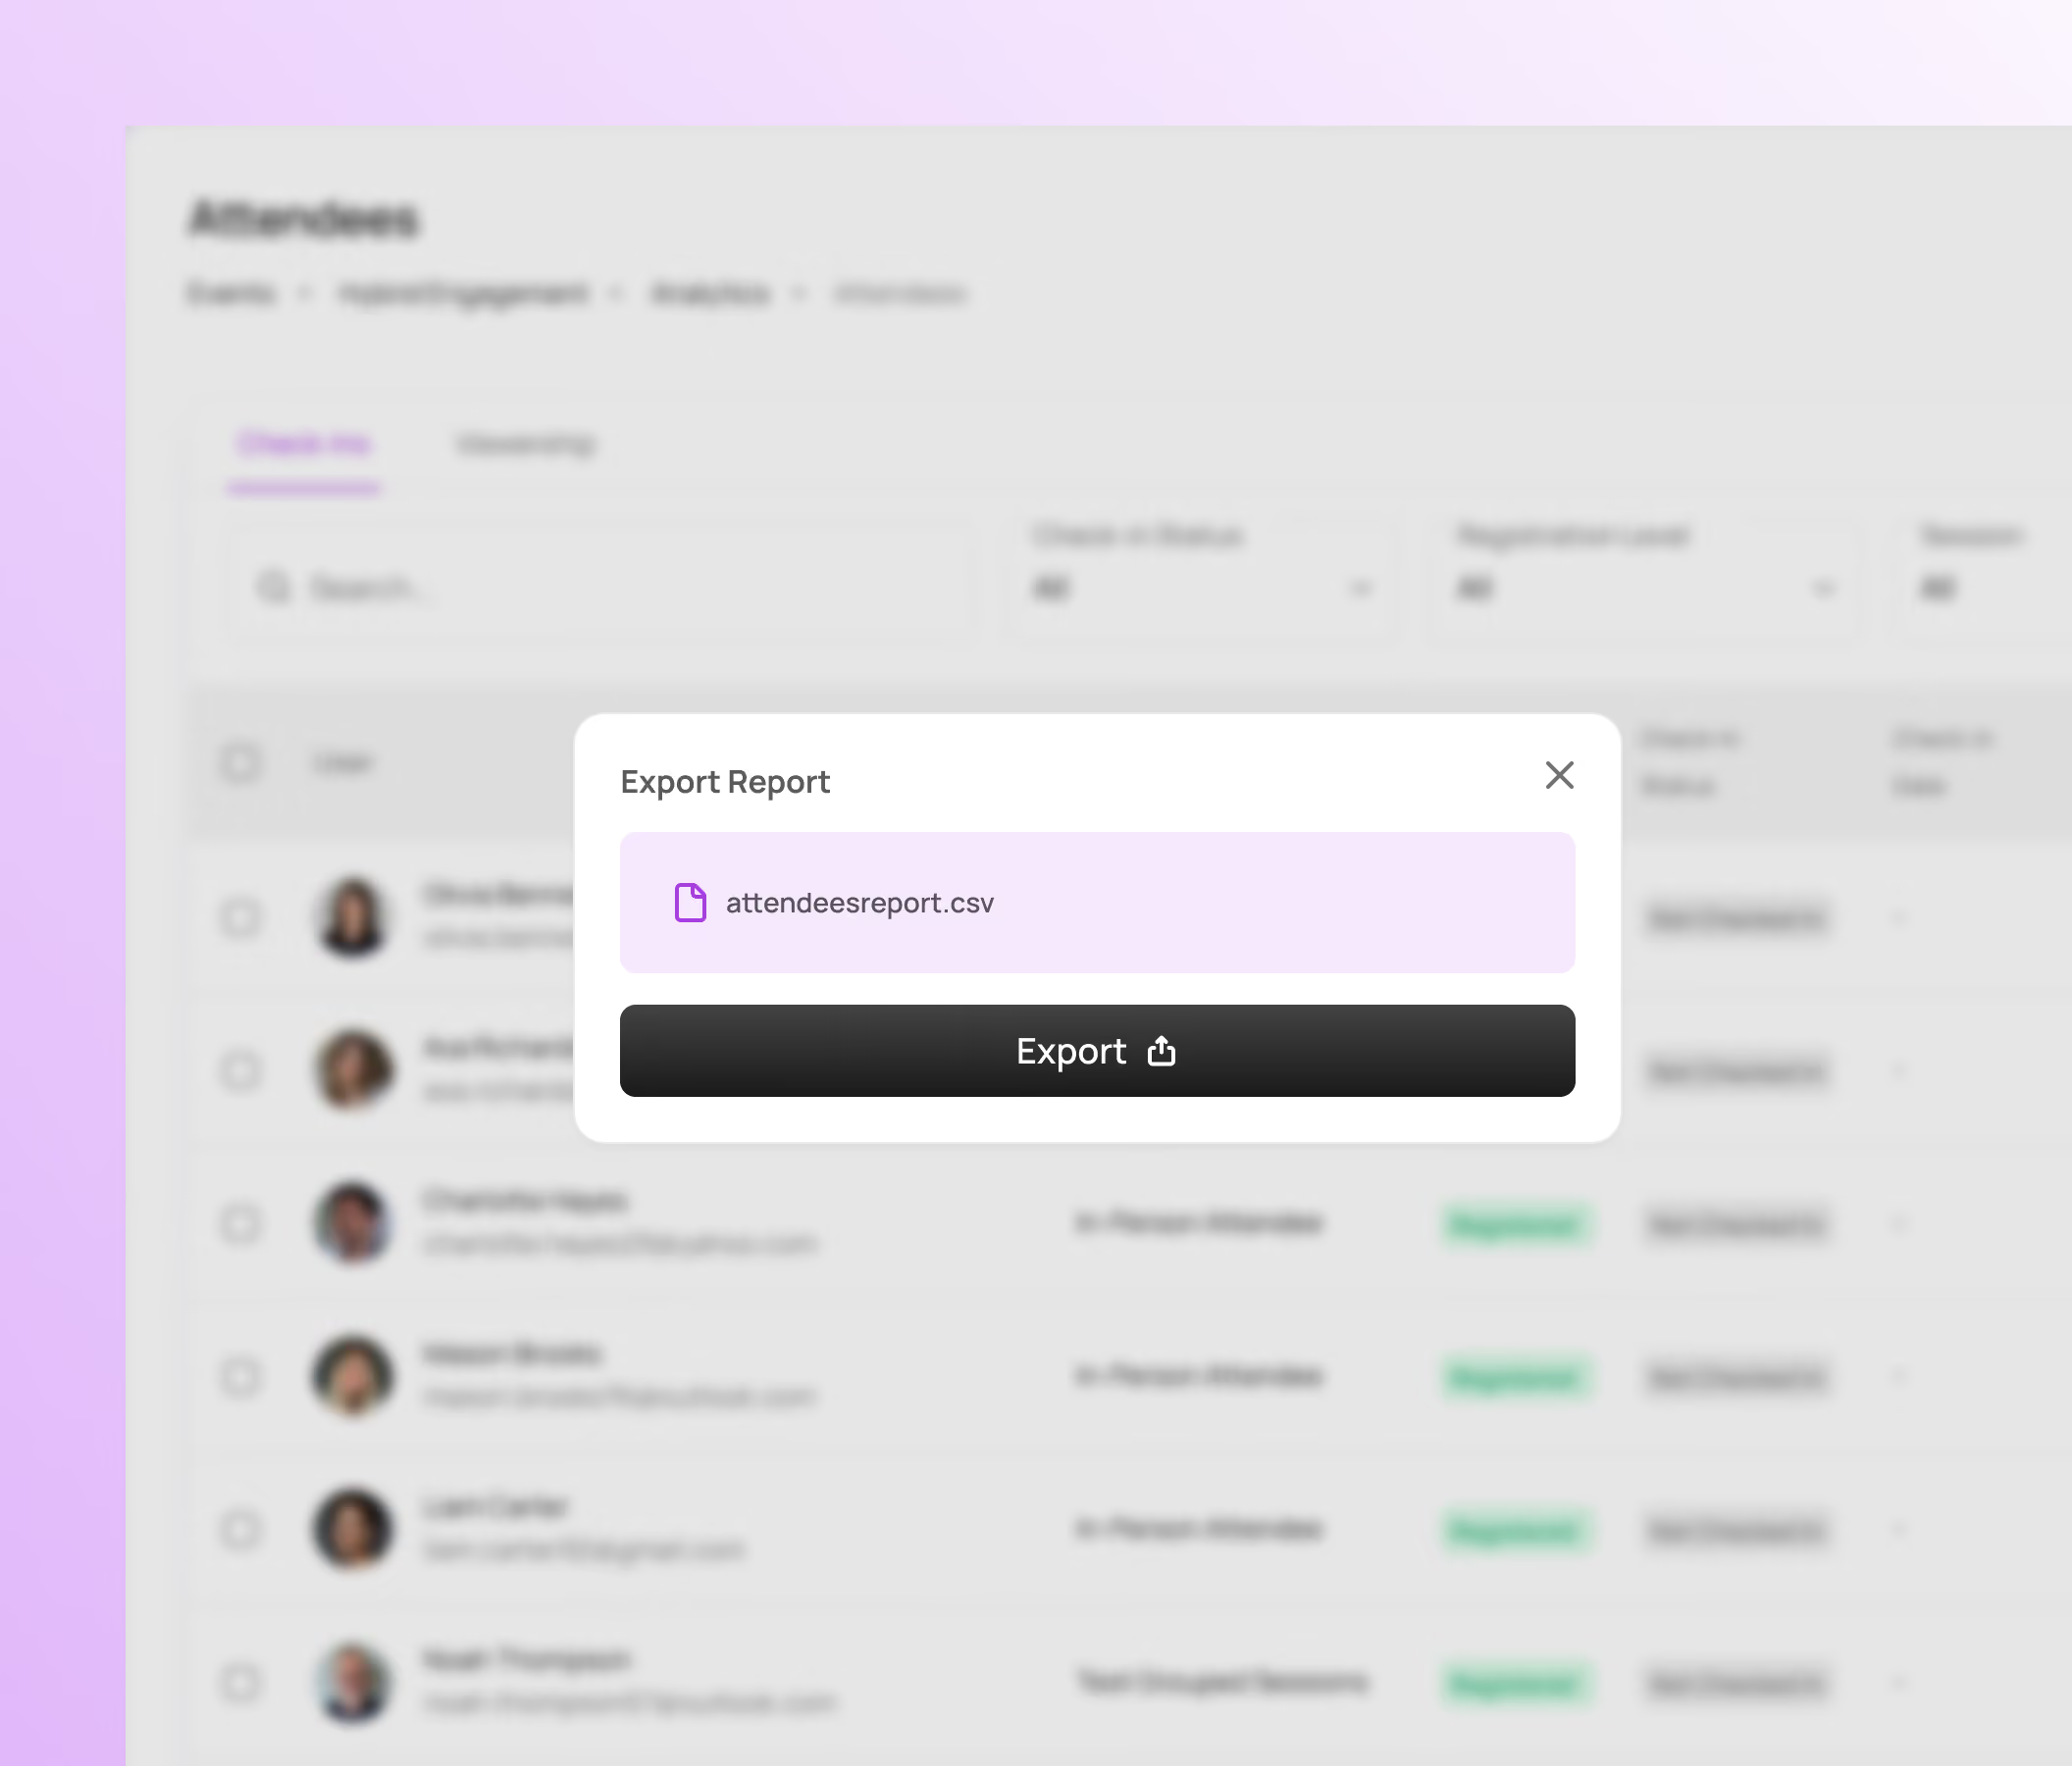
Get clean data exports without the cleanup work
Export attendance records, engagement metrics, and performance data in formats ready for analysis.
Analytics that work across every event format
Whether your event is in-person, virtual, or hybrid, your data stays consistent and easy to understand.
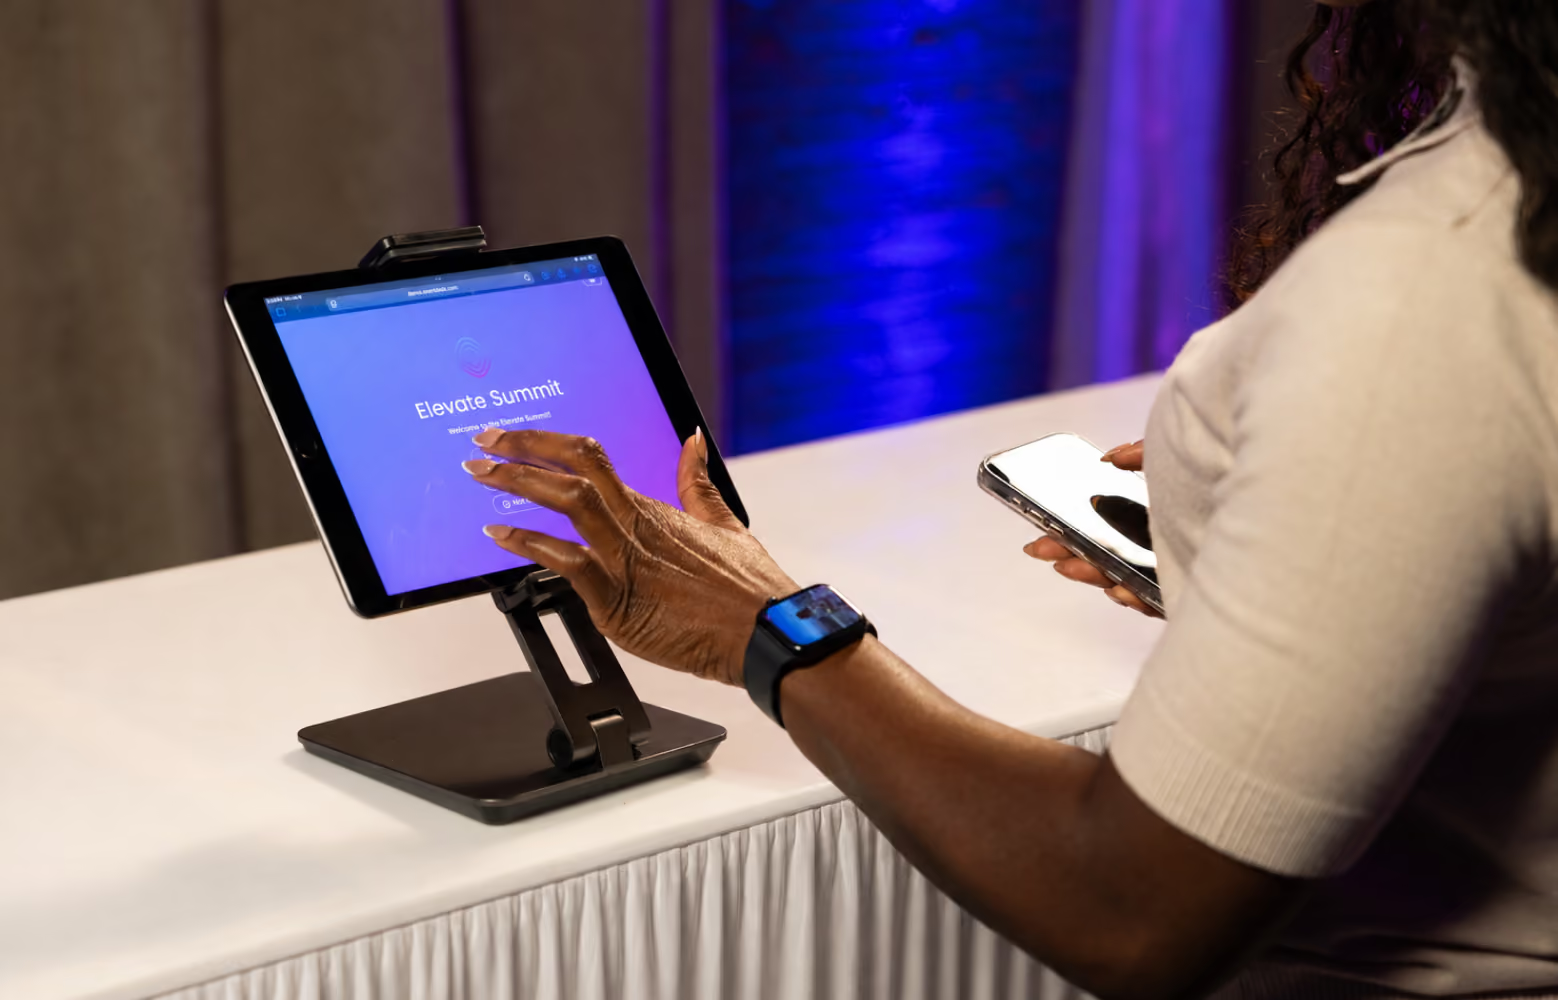
In-Person Events
Track registration, check-in, and session attendance in real time
See how attendance builds throughout the event and make adjustments as needed, then use the data to evaluate performance after it’s over.
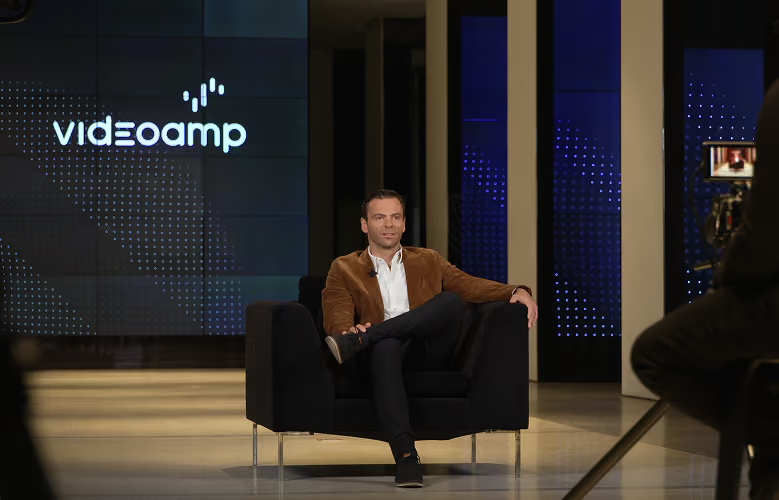
Virtual Events
Measure virtual engagement beyond simple view counts
Track livestream attendance, viewing duration, drop-off points, and interaction across chat and Q&A. See which sessions hold attention and where audiences disengage.
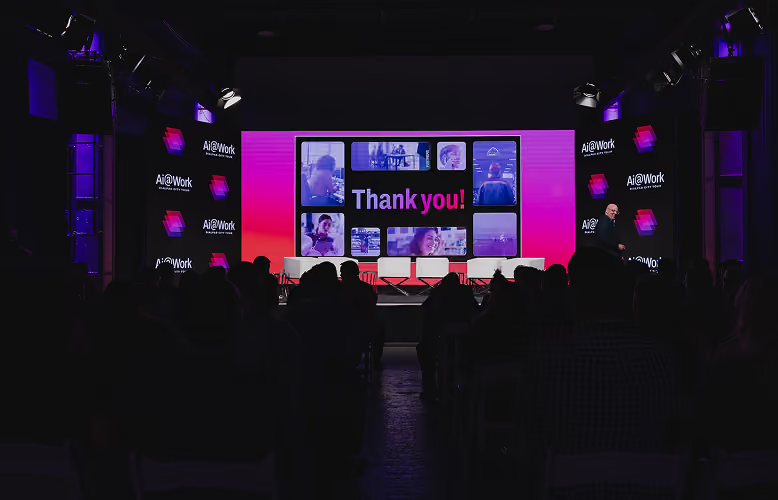
Hybrid Events
Compare in-person and virtual performance in one unified view
Track attendance rates across both formats, compare engagement patterns, and understand which sessions work better for remote versus on-site attendees.
Understand who registers and who actually shows up
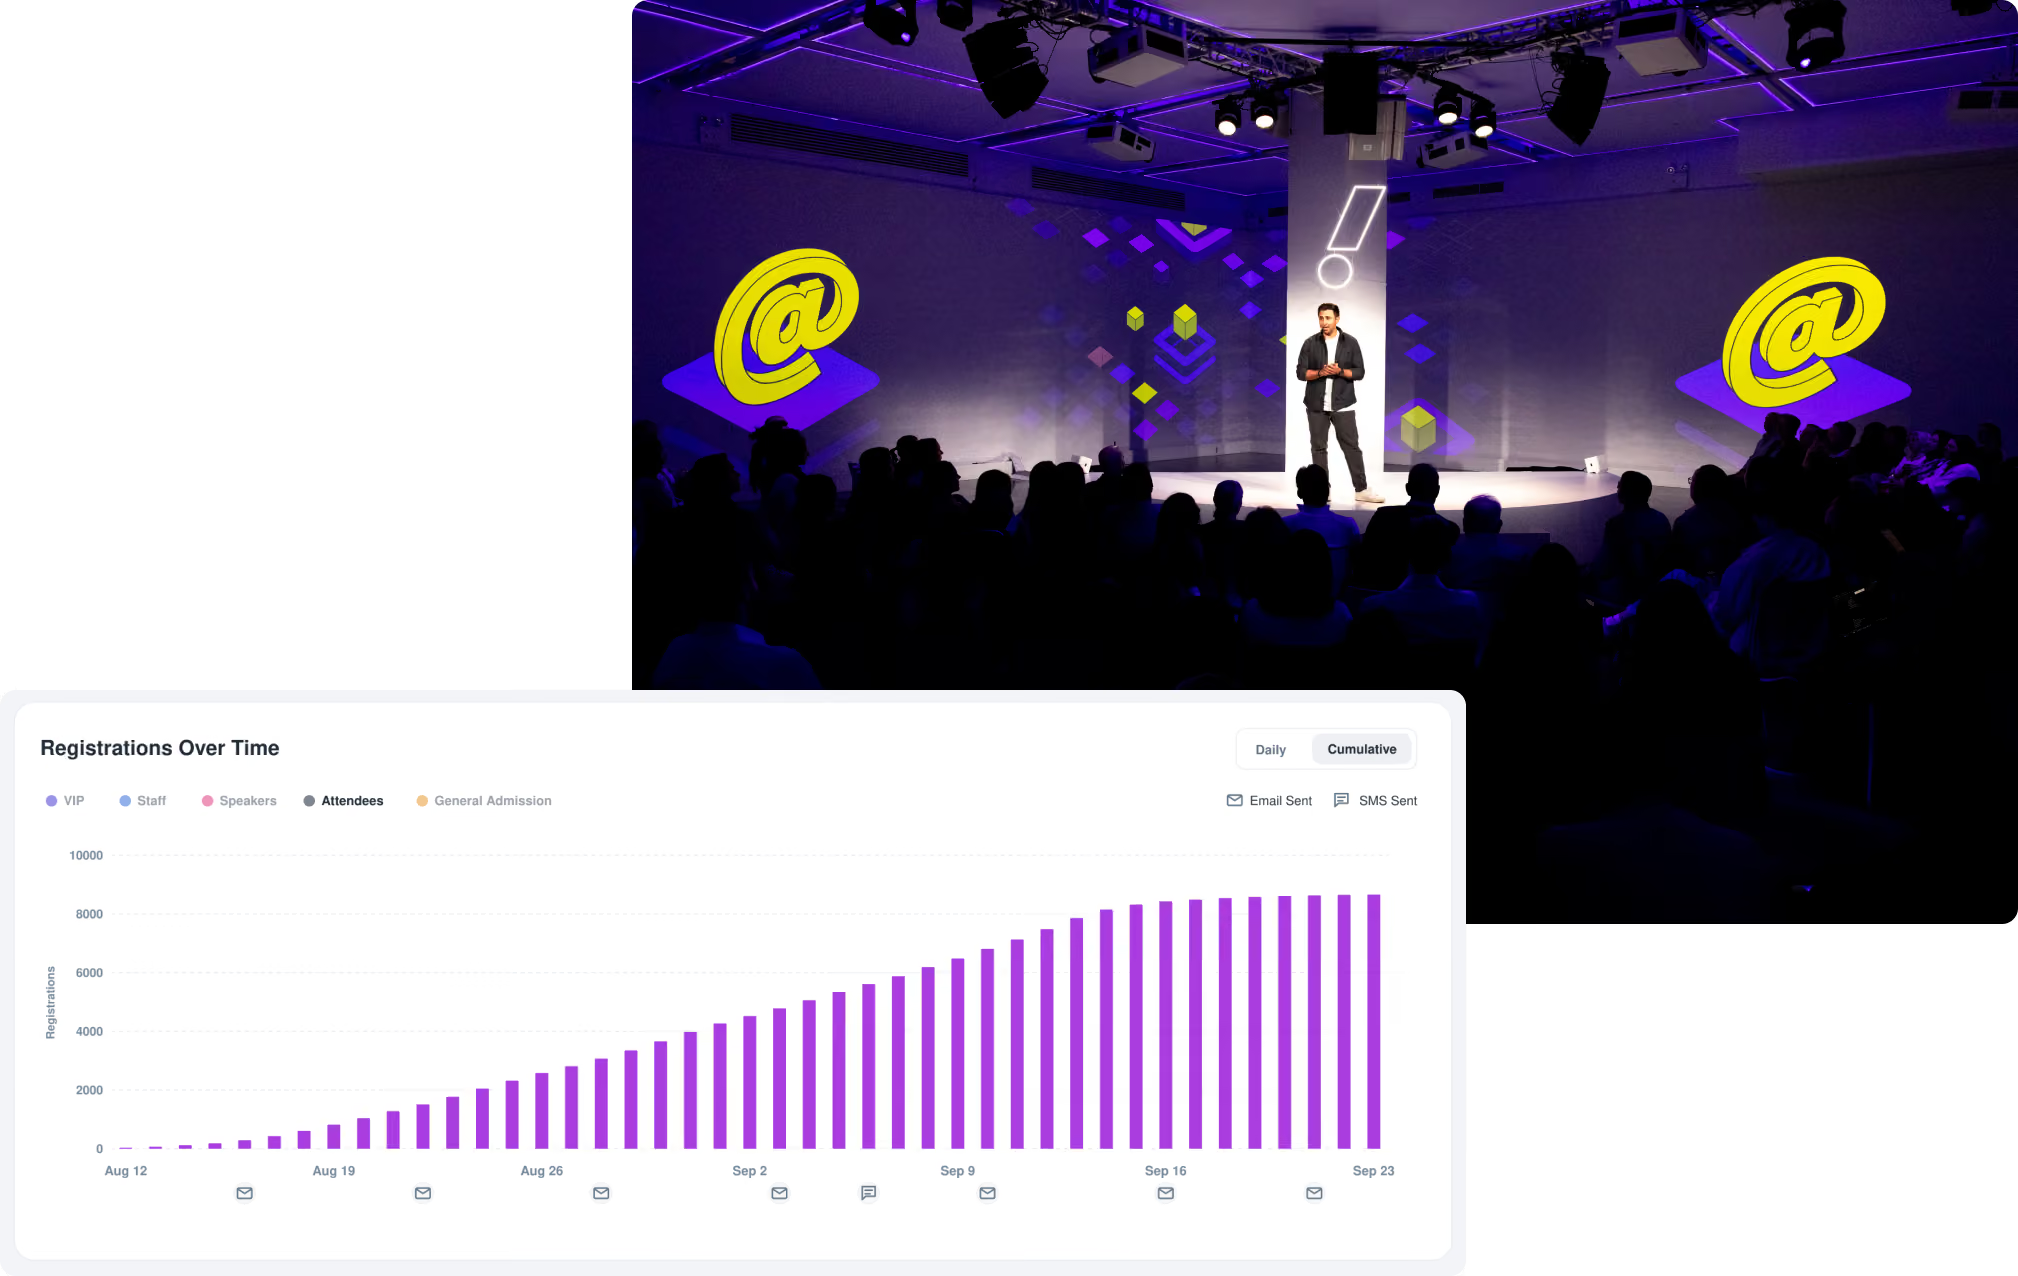
Track patterns in registration and attendance so you can plan more accurately and improve future events.

Attendance Rate
See which registration levels show up, where no-shows happen, and how attendance varies across formats.

Registration Level Breakdown
Track registrations by level, monitor capacity, and see which paths drive the most conversions.

Repeat Attendee Rate
Understand who returns across events and which formats or content drive repeat participation.
Measure how attendees interact with your content
Move beyond attendance counts to understand which sessions, content, and formats drive real engagement and deliver value to your audience.

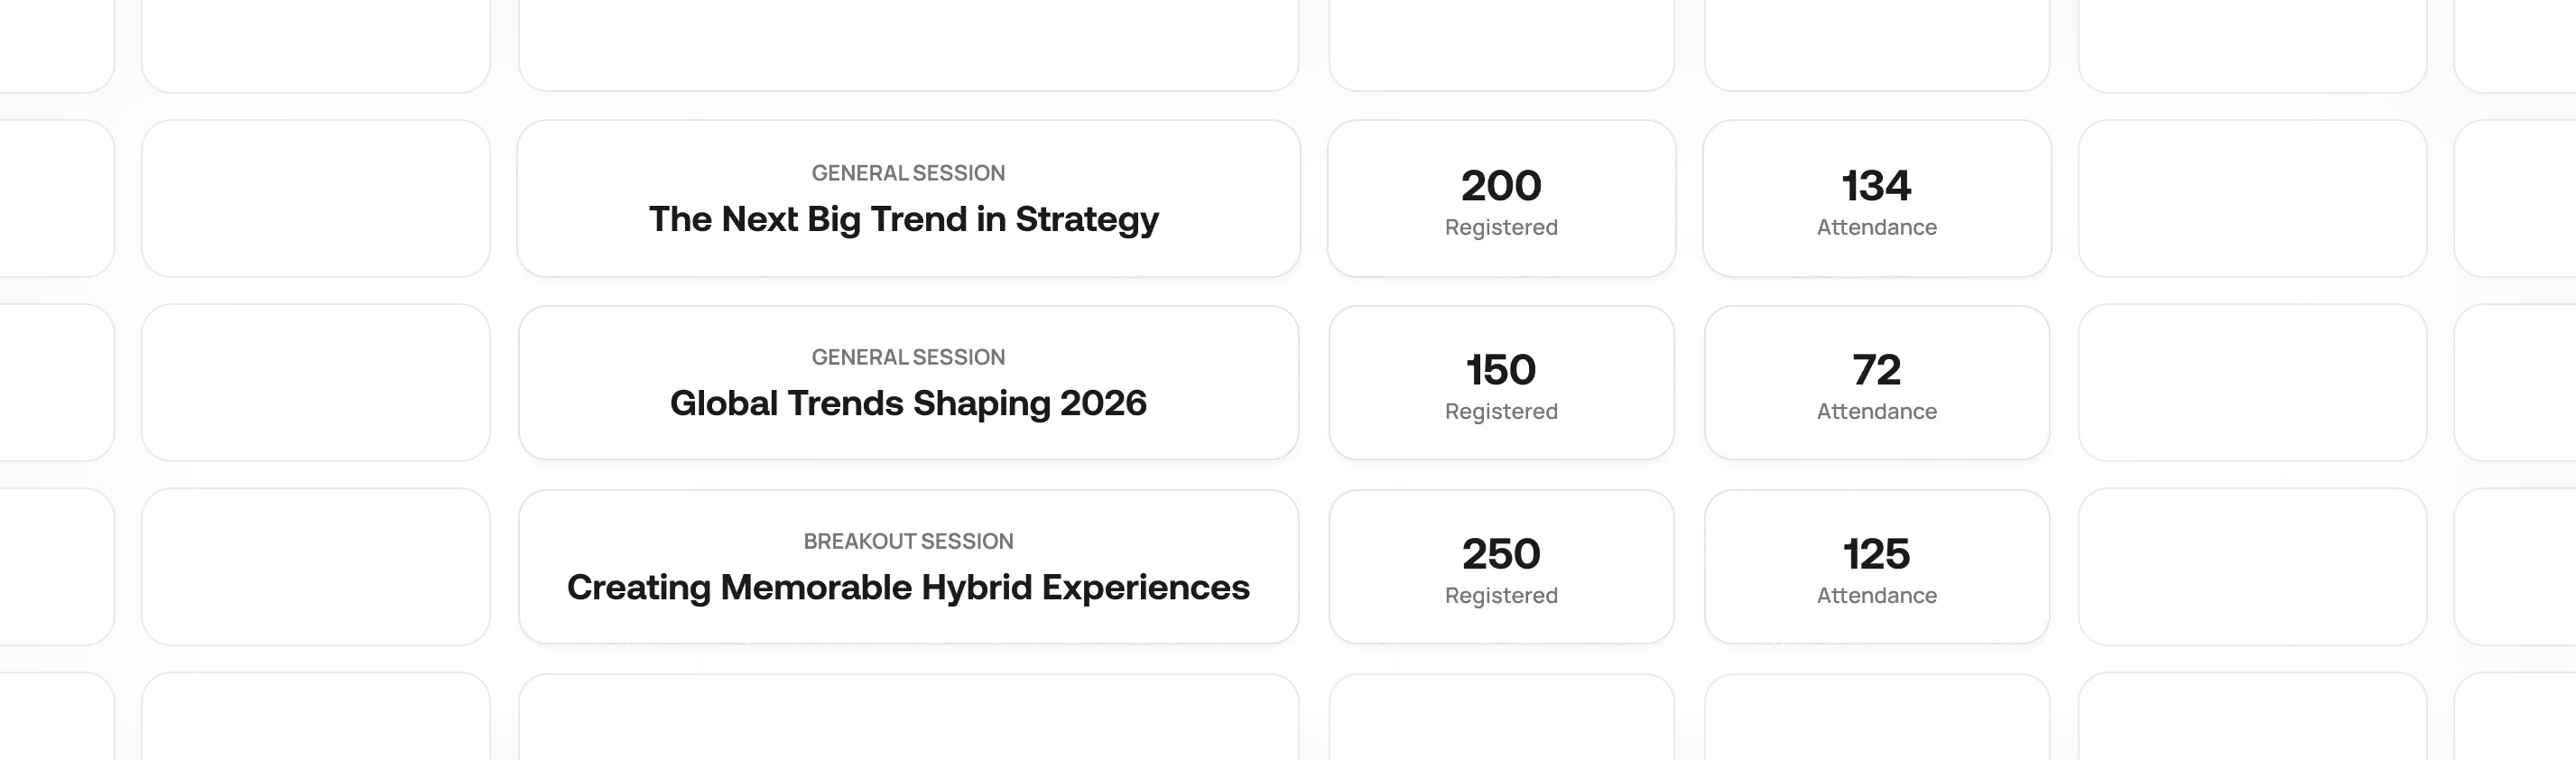
Session Attendance
See which sessions draw the most interest and how attendance shifts throughout your event.

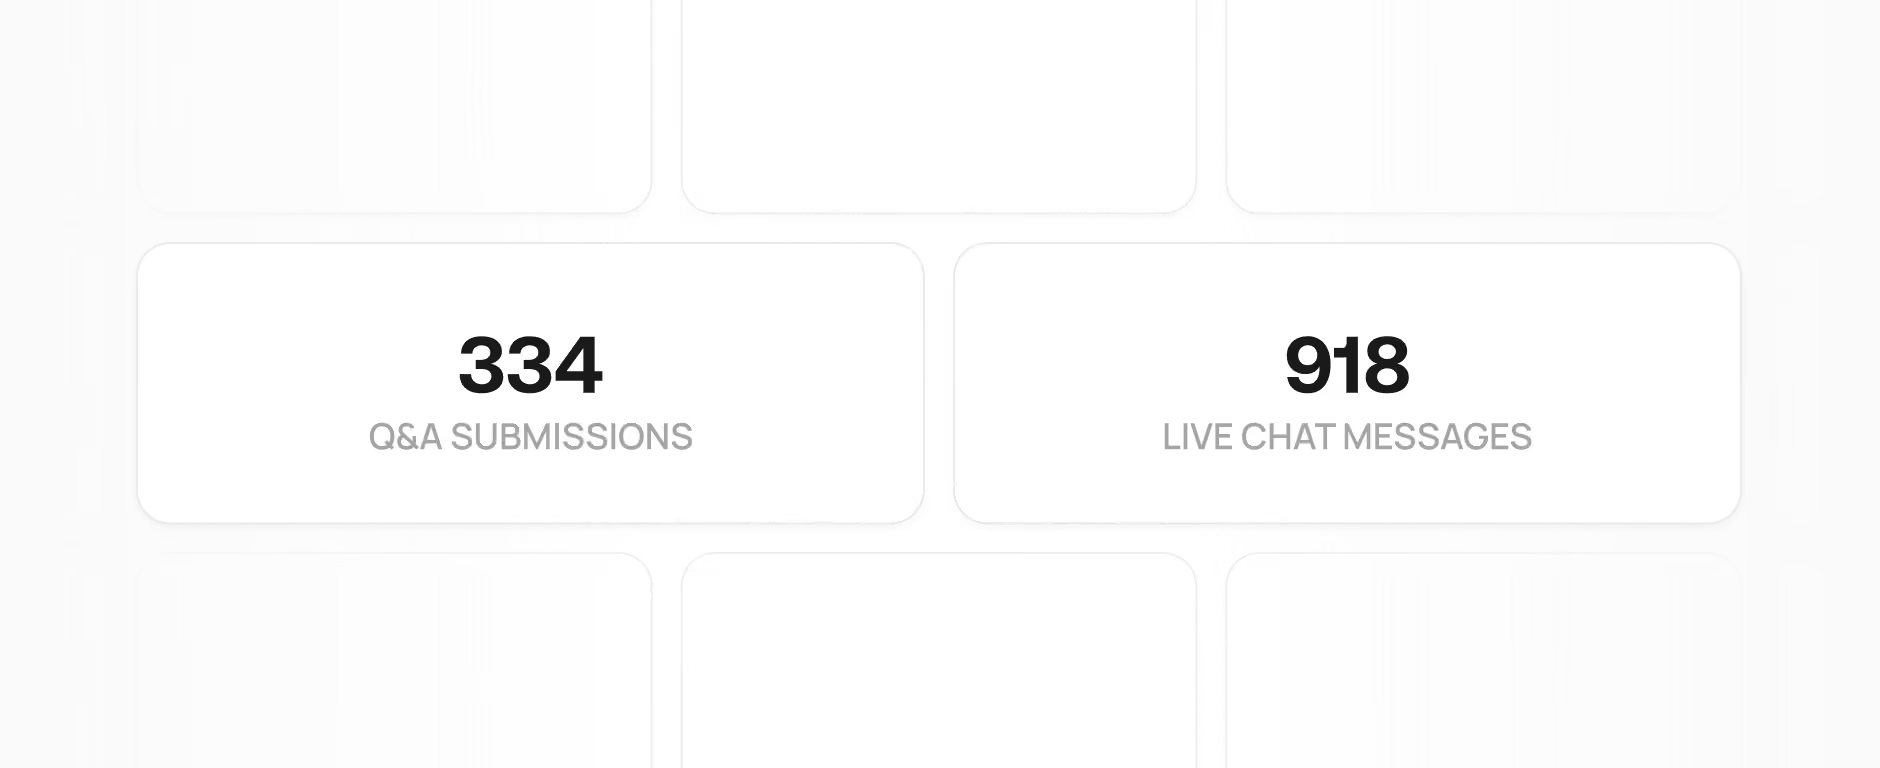
Q&A & Chat Participation
Track chat activity, measure Q&A participation rates, and identify which sessions generate the most audience interaction.

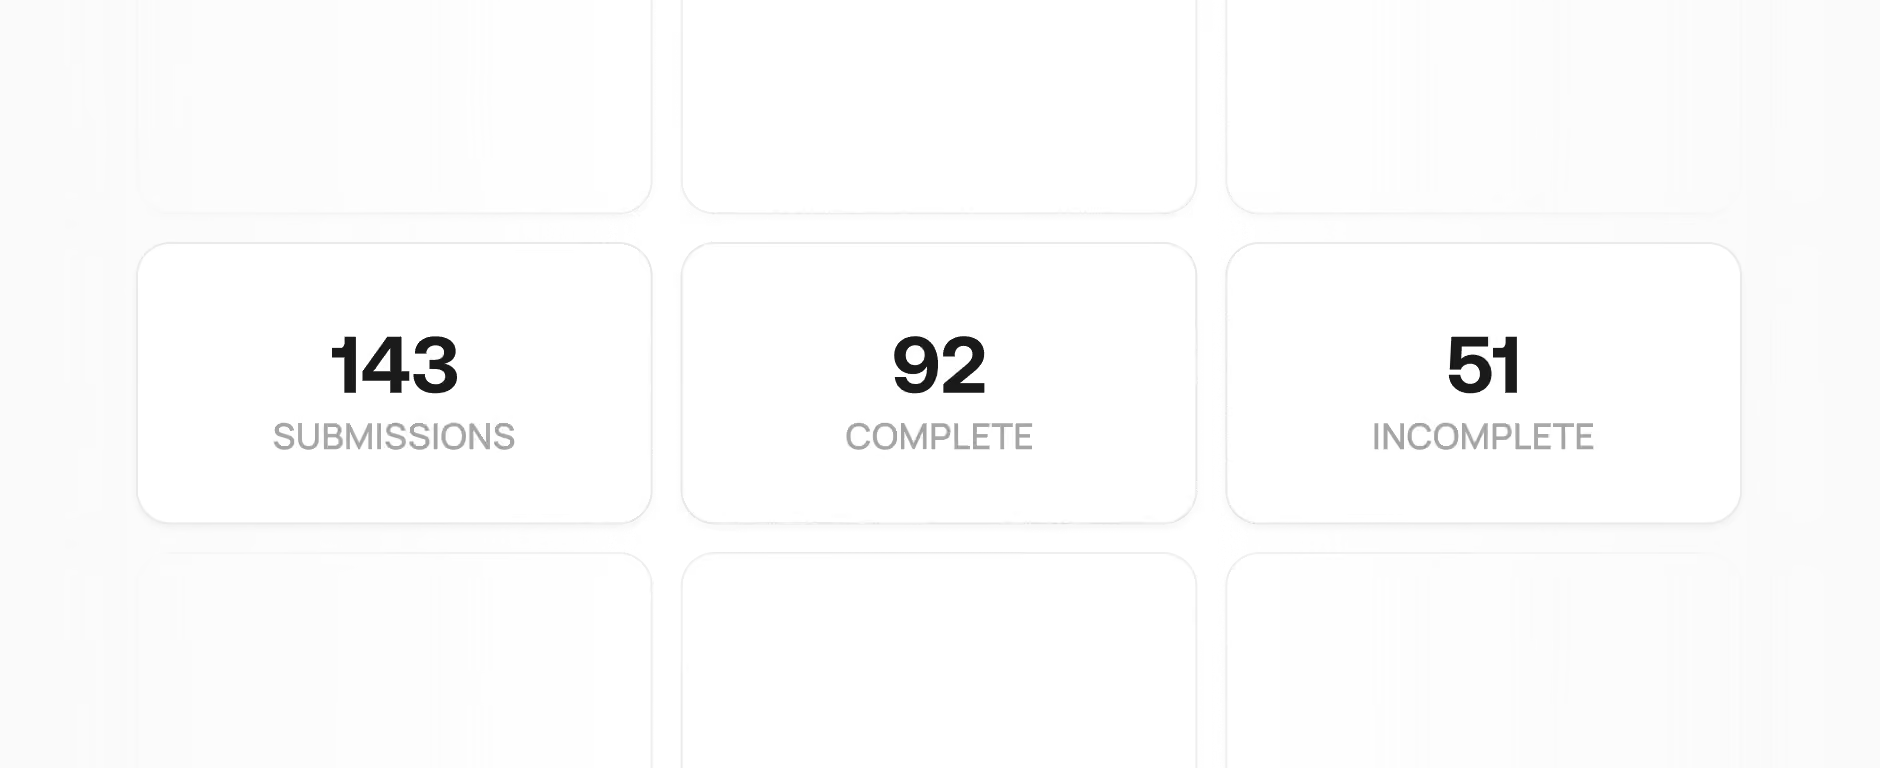
Poll & Survey Results
View responses in real time and understand sentiment the event across different groups.

Livestream & VOD Viewership
Track live viewers, replay behavior, and completion rates to see what content holds attention.
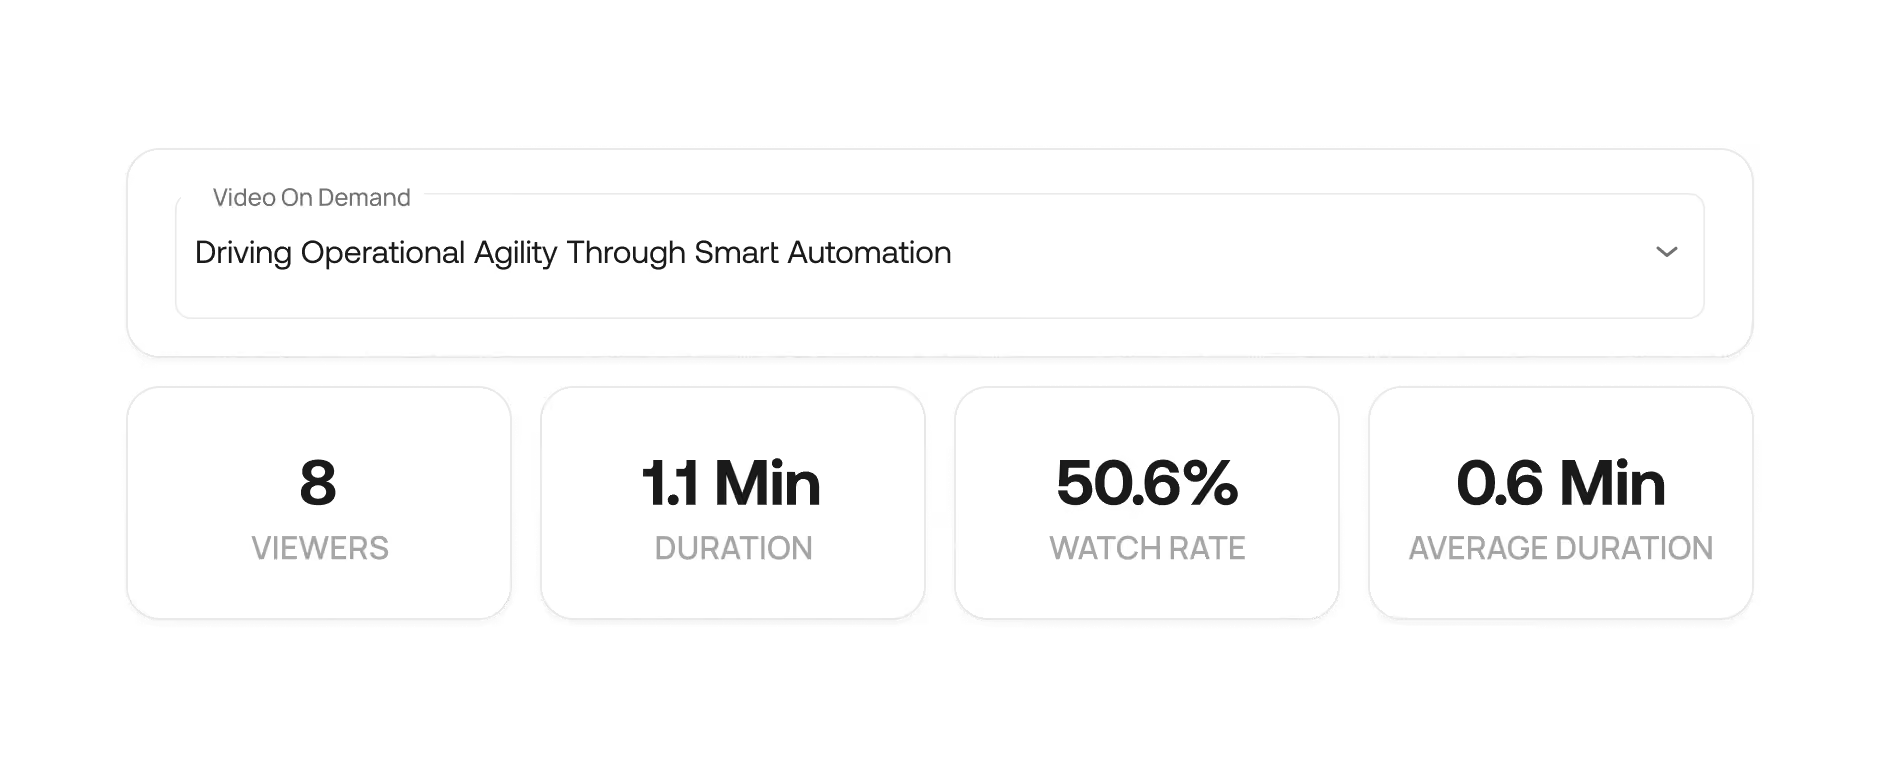

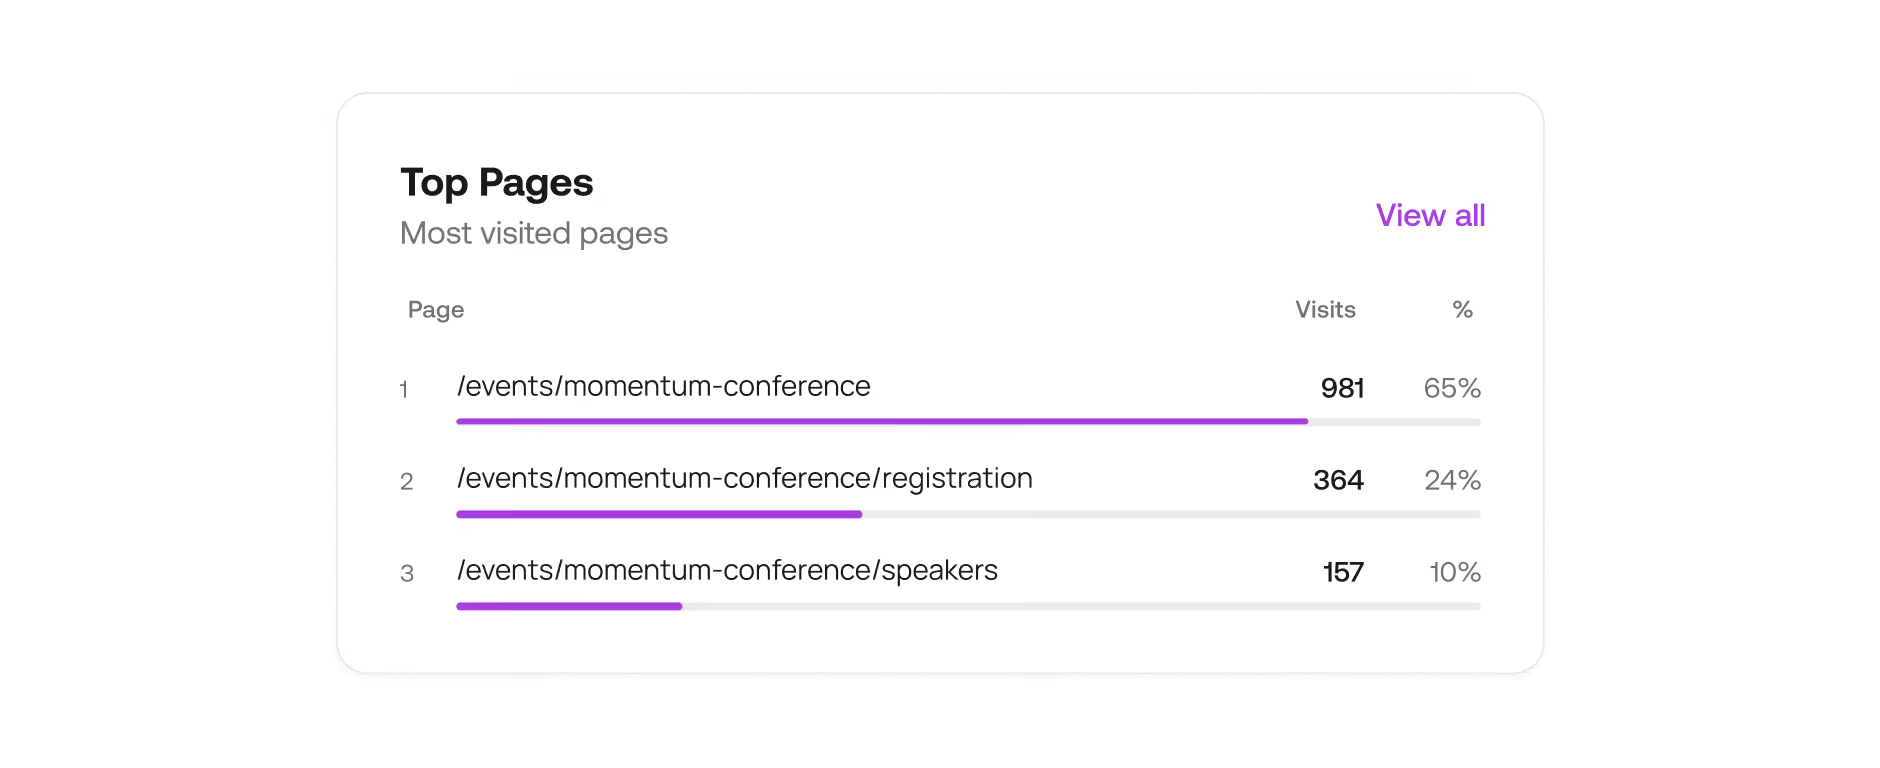
Event Site Analytics
See how attendees navigate your event, what they interact with, and which resources they use.
Connect marketing efforts to registration results
See which campaigns drive registrations and how your audience responds.

Pageview Metrics
Understand traffic, geolocation, and which paths lead to registration.

Email Open & Click Rates
Track performance across campaigns and see what messaging drives action.

Geolocation Breakdown
Understand where your audience is coming from and identify regional trends.

SMS Performance
See which messages drive immediate engagement and action.
Understand how virtual audiences engage with your content
See how audiences interact with your content during and after the event.

Live Viewer Count
Track concurrent viewers and identify peak moments.

Average Viewing Duration
Understand how long people stay and where they drop off.

VOD Views & Completion
See what content gets replayed and what’s watched through to completion.

Engagement During Stream
Track chat, Q&A, and poll participation during livestreams.
Why teams switch to Event Tech Stack
Built by event professionals for the reality of live events, where updates need to happen instantly, and your technology can't be the thing that breaks.
01
True Unified System
Data flows instantly across every part of your event without manual syncing or integration delays. Changes happen once and update everywhere in real time.
02
Built by Event Professionals
Built by people who've run events under real pressure and know that last-minute changes and live coordination aren't edge cases, they're how events work.
03
Flexible & Scalable
Scale your events without hitting artificial limits, feature restrictions, or pricing penalties. What works for your first event still works when you're running hundreds.
04
Quick Setup
Launch new events quickly by building on proven systems while maintaining full control over configuration and customization.
The platform event professionals lean on when it matters the most
From Fortune 500 companies and production agencies to small businesses, event professionals choose Event Tech Stack when seeking a reliable, flexible solution.

I wanted to say a massive thank you & well done for all your efforts. You made it all happen & work seamlessly and everyone is so appreciative of the success you pulled off – we’re all super impressed & grateful!
Jamie C.
Head of Production

We found ourselves in a very challenging position – and you and your intrepid team came through like no other. Beyond impressive. Closer to miraculous.Know you have made a LOT of friends at EY.
Lisa S.
Director, Brand, Marketing & Communications, Americas

Managing a complex footprint across Cannes requires technology that gets out of the way. Event Tech Stack allowed us to deliver a unified experience across more than 20 events. One registration journey and one credential made navigating our Cannes program completely effortless for our partners and guests.
View Case StudyBrian
Global Tech Director, B2B Marketing

We did it! This was one for the books – and certainly a virtual event we are very proud of. Everyone is very pleased!
Jenna C.
Senior Account Director

Thank you for all you have done to make every Light The Night event spectacular this season. From building the platform – to customizing the platform across the 78 market sites – to executing the event nights with us. HUGE THANKS!
Jana B.
VP Campaign Development, Community Initiatives

Everyone was incredibly pleased with the Service Heroes Virtual Event and we’ve been flooded with amazing feedback from executives! We wanted to extend our sincerest thank you to the ETS Team.
Amanda S.
Senior Producer

Attendees were loving every bit of the platform and content! Through your tireless efforts between pre-production and during the show, this was certainly a success and we’re grateful for your partnership along the way.
Jon S.
Senior Producer
Connecting registration and real-time attendance across 20+ experiences and hundreds of meetings into one dataset transformed how we measure festival ROI. Rather than ending the week with siloed lists from separate venues, Event Tech Stack gave us a single source of truth across our entire Cannes presence.
View Case StudyBarton
Director, Global Marketing Ops & Analytics


One platform to power every part of your event
Explore how Event Tech Stack unifies your entire event ecosystem in one scalable platform.

Event Registration
Flexible event registration structures with access controls, approval workflows, and session-level permissions.

Event Marketing & Communications
Send event emails and SMS communications directly from the platform with built-in tracking and segmentation.

Event Websites
Launch fully branded event websites with integrated registration and dynamic content management.

Capacity & Waitlist Management
Control event and session attendance with configurable capacity limits and automated waitlists.

Livestream & VOD
Stream live sessions and deliver on-demand content using built-in video infrastructure.

Onsite Check-in & Badging
Manage high-volume attendee check-in with QR scanning, kiosks, and on-demand badge printing.

Attendee Event Hub
Provide attendees with one destination for accessing events, sessions, and content across web and mobile.

Analytics & Reporting
Monitor registration, attendance, engagement, and livestream performance in real time.

AI Event Builder
Generate event structures, pages, and communications using AI-assisted setup workflows.

Mobile App with Real-Time Sync
A mobile app that syncs instantly with the event platform so attendees always see the latest schedule, sessions, and updates.

Multi-Event Management
Manage multiple events from one platform with shared settings, branding, and data. Reuse templates, track performance across events, and scale without rebuilding from scratch.

Networking & Engagement
Let attendees connect, chat, and engage with speakers, sponsors, and other attendees to grow their network and build connections.
Frequently Asked Questions
Quick answers about analytics and reports in Event Tech Stack.
How often are dashboards updated?

Dashboards update in real time as data comes in. You see registration, attendance, and engagement metrics as they happen, not hours or days later.
Can I compare metrics across multiple events?
Absolutely! You can export your event analytics data in CSV format.
Do I get analytics for both in-person and virtual attendees?
Yes, Event Tech Stack tracks metrics across in-person, virtual, and hybrid attendees in one unified analytics view, so you can compare performance across formats.
Can I see who opened or clicked an email?
Yes, you can track email opens and clicks at the individual recipient level.
What kinds of reports are available for surveys?
You can view response rates, analyze individual question results, compare responses across attendee segments, and export raw survey data for deeper analysis.
Can I view analytics by registration level or status?
Yes, you can segment all analytics by registration level, attendee type, or registration status to understand how different audience segments engage with your event.
See How Event Tech Stack Powers Your Events — In Just 30 Minutes
Book a live demo to see how Event Tech Stack supports your specific event format.